Data & business intelligence for SMEs
We combine data from ERP, CRM, production and finance and define with you how each KPI is calculated. On this basis we build dashboards that management and departments use in their daily work.
Power BI · Microsoft Fabric · SAP Datasphere · Snowflake
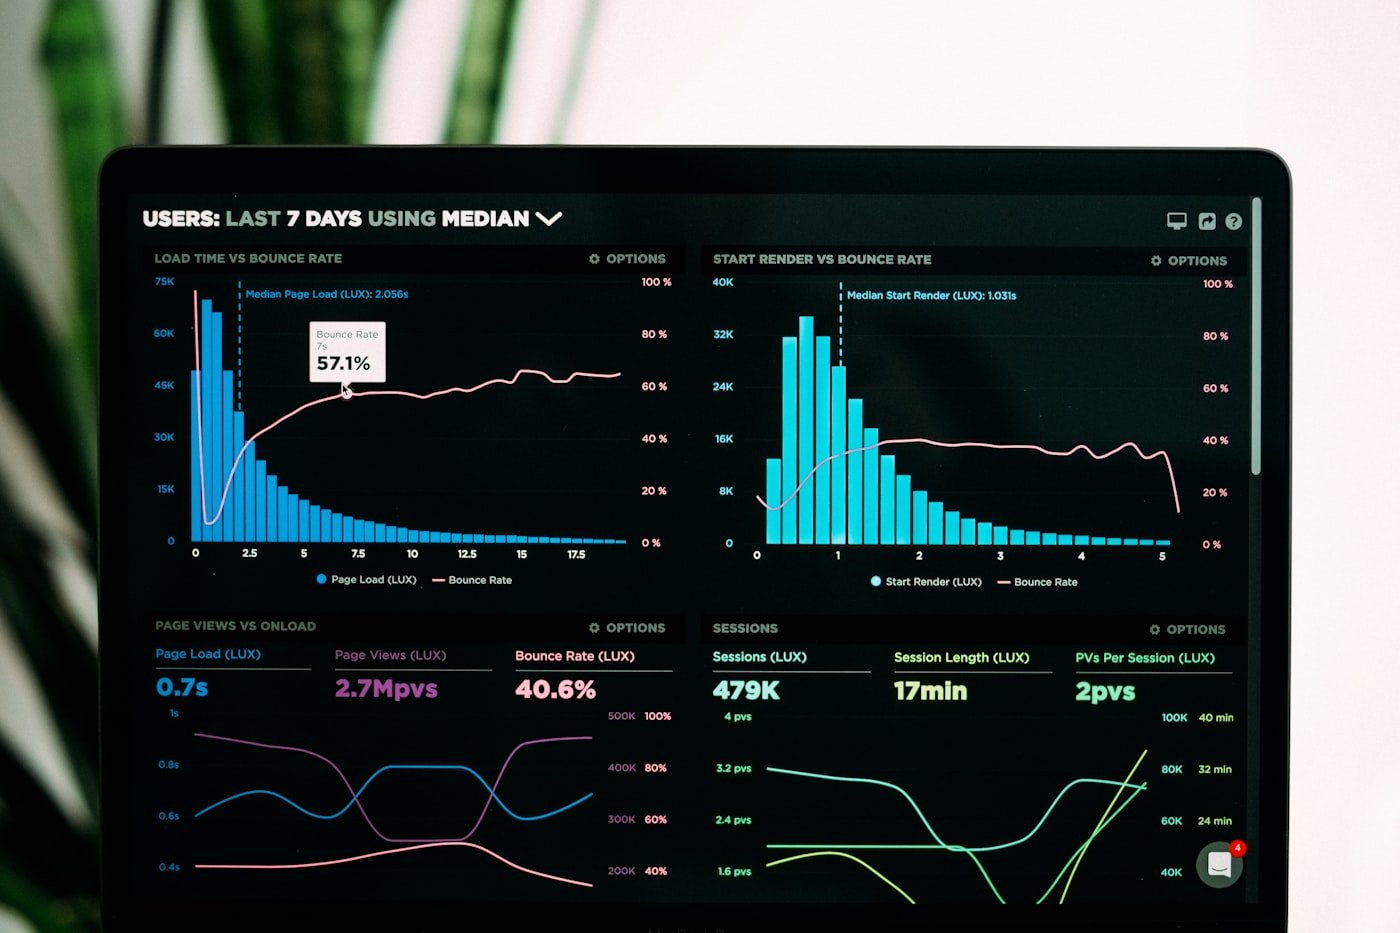
When every department has different figures
Sales reports a different order intake from controlling because they count differently. Monthly reports are compiled in Excel, copied together by hand. That costs days every month, and meetings end up arguing about the figures instead of the decision.
So we start with shared definitions and agree what counts as order intake and how margin and on-time delivery are calculated. Only then do we build data pipelines and reports.
Typical reports
We start with a specific management question and define the KPIs, owners and update schedule for each solution.
Corporate management
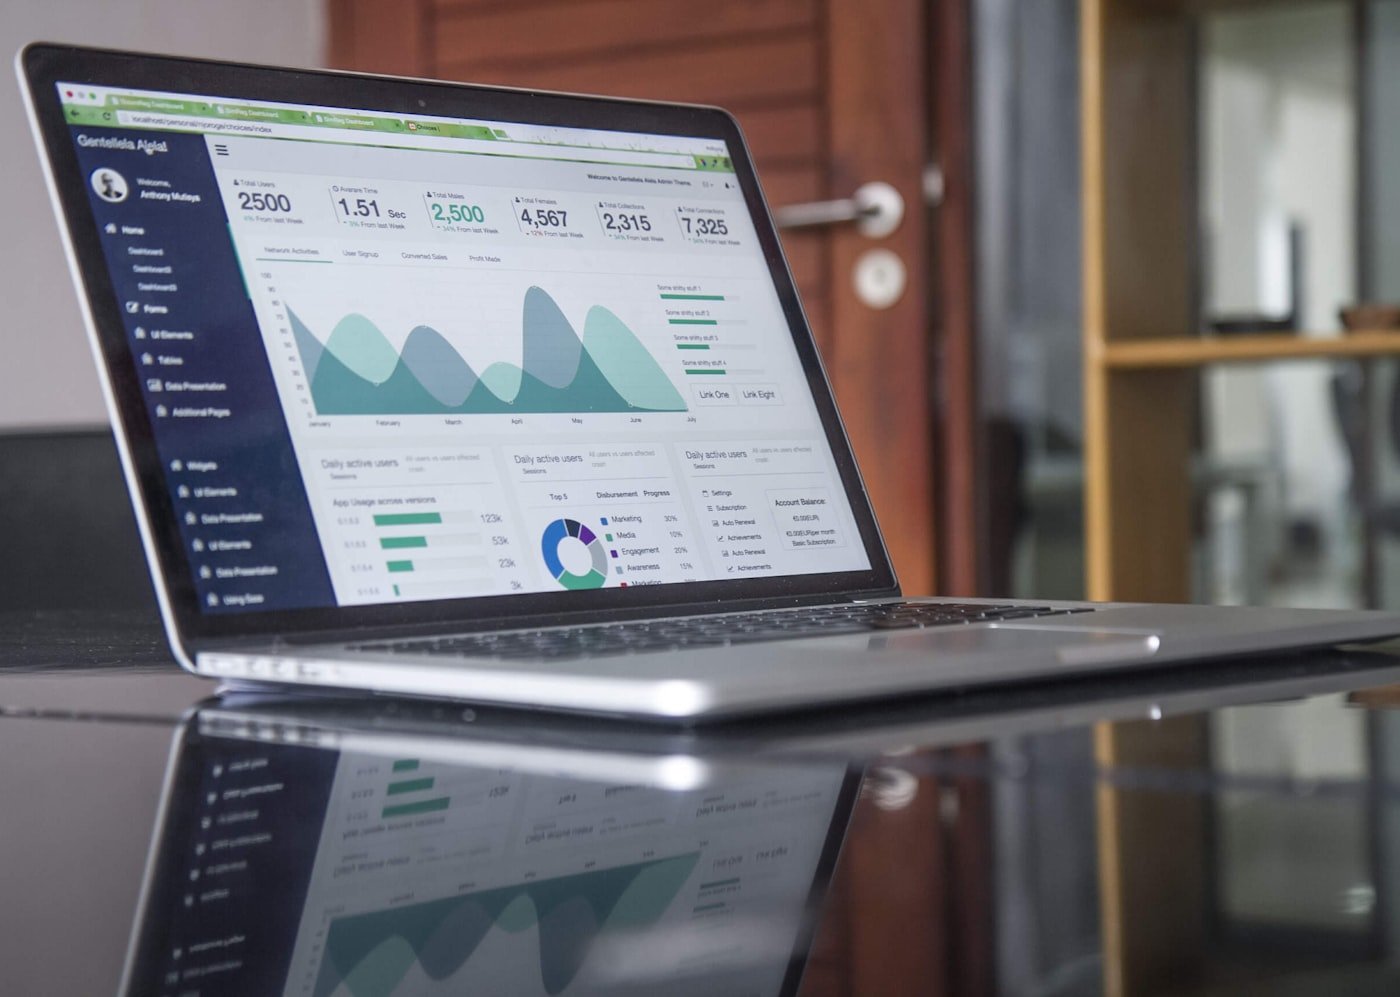
Management cockpit, plan versus actual comparison and consistent reporting across entities, plants and business units.
Finance and controlling
Contribution margins, cost centres, working capital, cash flow and automated variance analyses for the month-end close.
Sales and service
Pipeline, order intake, customer profitability, service levels and causes of complaints.
Production and quality
OEE, scrap, rework, downtime and lead times down to the individual line.
Purchasing and warehouse
Stock levels, days of supply, on-time delivery, purchase prices and demand forecasts.
Maintenance
Asset availability, maintenance backlogs, spare parts consumption and recurring faults.
Data as the foundation for AI
Many AI use cases fail because of the data. A draft quote is only as good as the item master, and a report commentary only as good as the KPI behind it. That is why a clean data foundation often comes before the first AI project.
Conversely, AI helps with reporting: it flags variances and drafts commentary. The calculations still happen in the BI system so that the figures are correct.
Platforms
The platform depends on your source systems, licences and existing skills. If Microsoft 365 is already in place, Power BI and Microsoft Fabric are usually the obvious choice. For SAP-heavy landscapes, SAP Datasphere is an option, and for large or mixed data volumes, Snowflake. Sensitive data can be processed in an EU region or on your own servers.
When a BI project is not worth it
For individual reports from one or two sources, the reporting in the ERP or a simple Power BI file is often enough. A separate data layer such as a data warehouse only pays off when several systems come together and figures are to be compared over years.
We only recommend switching platforms if it pays off.
Approach
Management question and KPIs
We clarify which decision the analysis should improve and which KPIs it needs. We agree the definitions together.
Connect and check data
Source systems are connected automatically, and validation rules make errors and gaps visible.
Model and dashboard
KPIs are modelled centrally, and reports with role-based access rights are built on top.
Rollout and operation
Training for users, owners for each data domain, monitoring of data quality.
Frequently asked questions about business intelligence
Do we need a data warehouse or is Power BI enough?
For individual reports from one or two sources, Power BI is often enough. As soon as several systems come together and figures need to be compared over time, a dedicated data layer such as a data warehouse or lakehouse is more stable and faster.
How long does a first dashboard take?
That depends on the data situation. It goes faster if we start with a single management question instead of the whole company. We give you the timeframe after the analysis.
Can we analyse SAP data?
Yes, SAP systems can be connected, either via SAP Datasphere or via standard connectors into other platforms. It is important to carry over the business meaning of the SAP objects.
What does business intelligence have to do with AI?
Many AI use cases need clean master and transaction data. And AI can flag variances and suggest commentary in reporting, but the calculations happen in the BI system.
Consistent KPIs across your company
Tell us the KPI or report that takes the most effort today. In the initial consultation, we tell you how we would approach it.
